Chart screenshot in. Editable PowerPoint chart out.
Paste a picture of a chart from a report, paper or slide. ChartSnap reads the numbers, lets you check them in a table, and gives you a native PowerPoint chart and an Excel sheet you can edit.
- 7 chart typescolumn, bar, line, area, pie, doughnut and scatter
- Measuredaccuracy is published below, chart by chart
- 3 free a dayno account, no card
How it works
Paste or drop a screenshot
Press Ctrl V after taking a screenshot, or drop PNG and JPEG files. Crop to one chart for the best result.
Check the numbers
The values appear in a table next to your screenshot and a redrawn copy. Values estimated from gridlines are shaded so you know exactly what to check.
Download PowerPoint and Excel
You get a real PowerPoint chart, not a picture: restyle it, change the type or right-click and choose Edit Data. The Excel file has the same table.
Convert a chart
One chart per image works best. Your screenshot is read by an AI model and isn't stored.
Paste a chart screenshot here
Press Ctrl V (⌘ V on a Mac), drop images on this box, or choose files. PNG, JPEG, WebP or GIF.
Examples
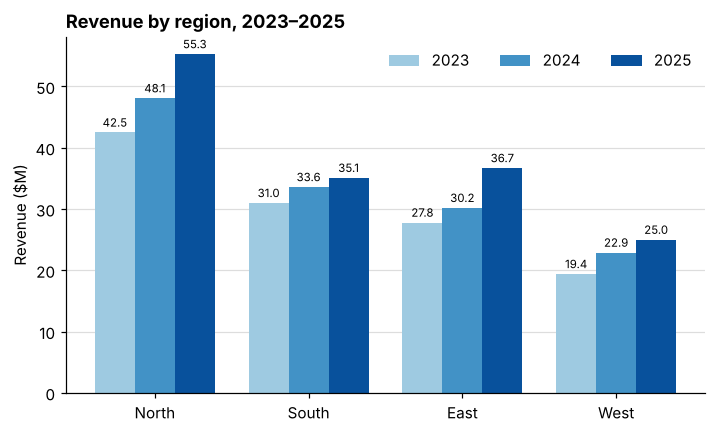
Real runs. Each screenshot below was read by ChartSnap in standard mode, then exported to PowerPoint. The right side is the exported file, opened.
Chart types
Everything below becomes a native PowerPoint chart of the same type, with its data inside it.
Not supported yet
- Combined bar and line charts are read as their main type; add the other series in PowerPoint.
- Waterfall, funnel, gauge, map, radar and 3D charts.
- Logarithmic or broken axes: values may be off, so check them against the source.
- Several charts in one screenshot: crop to one chart at a time.
- PDF files: take a screenshot of the chart instead.
Accuracy
We test ChartSnap on a fixed set of charts with known data and publish the result. Values printed on a chart are copied; the rest are estimated from the gridlines and shaded for you to check.
Measurement in progress.
Who uses it
Consultants and analysts
Rebuild a client's or a competitor's chart in your own template in minutes, instead of retyping numbers from a PDF.
Students and researchers
Pull the numbers out of a figure in a paper to compare results or redraw it in your style. Cite the source line on the slide.
Product and marketing teams
Last year's chart only exists as an image? Recover the data, update it with this year's numbers and keep the chart editable.
Pricing
Try it free. Upgrade when you need the editable files.
Free
See what ChartSnap reads from your chart.
- 3 charts a day
- Data table and redrawn preview
- Edit values and copy the table
- No PowerPoint or Excel downloads
Pro monthly
For a busy reporting season or a single project.
- Editable PowerPoint charts
- Excel and CSV downloads
- Several screenshots at once, one deck out
- Color schemes for your template
- Accurate mode: a second read by a larger model
- Up to 300 charts a month
Pro yearly
Everything in Pro for half the monthly price.
- Everything in Pro monthly
- $4 a month, billed once a year
- Up to 300 charts a month
Prices are in US dollars. Checkout, payment and tax are handled by Polar, our merchant of record, so your card details never reach us. Subscriptions renew automatically each month or year until you cancel, and you keep Pro until the end of the period you've paid for. All sales are final: we don't offer refunds, except where the law requires one, so please try the free plan first. Your license key appears as soon as you've paid and is also emailed to you.
Questions
What happens to my screenshot?
It's sent to Anthropic's Claude API, which reads the chart and returns the numbers. We don't store your image or the numbers on our servers; the table lives in your browser until you close the page. Under Anthropic's commercial terms, API inputs aren't used to train its models. Don't upload charts you aren't allowed to share with a service provider.
How accurate is it?
Values printed on the chart are copied exactly. Values without labels are estimated from the gridlines, which is usually within a few percent of the axis range, and those cells are shaded so you can check them. See the Accuracy section for our measured results.
Is the PowerPoint chart really editable?
Yes. It's a native PowerPoint chart with its data inside it. Click it to restyle it, change the chart type, or right-click and choose Edit Data to change numbers in Excel. It also opens in Keynote and LibreOffice. Google Slides turns imported charts into pictures, so use the Excel file there.
What's accurate mode?
It reads the chart with a larger AI model (Claude Sonnet instead of Claude Haiku). On our test set both modes got every value right, so use it as a second opinion for unusual or very dense charts, or when the shaded cells don't look right. It's included with Pro and counts toward the same 300 charts a month.
Can I convert a chart from a PDF?
Take a screenshot of the chart (Windows: Win+Shift+S, Mac: ⌘+Shift+4) and paste it here. Crop to one chart for the best result.
What are the limits?
Free: 3 charts a day. Pro: up to 300 charts a month, and up to 20 screenshots at a time. If ChartSnap is unusually busy, new charts may pause until the next day.
How do I cancel?
Use the link in your purchase email to open Polar's customer portal and cancel there. You keep Pro until the end of the period you've paid for.
Can I get a refund?
All sales are final, so we don't offer refunds, except where the law requires one. Use the free plan and the samples first to make sure ChartSnap works for your charts.
Can I use charts from other people's reports?
ChartSnap recovers the numbers; you're responsible for having the right to use them. Add the original source on the slide with the source line option.